Finding Performance Bottlenecks in JavaScript.
One of my hobbies is to write (and sometimes re-write) graphic libraries and do some nice animations. One side effect of this is that when your code is not performant the animation on the screen will let you know, as simple as that.
To test my graphic library I wrote a small animation that draw 1600+ particles, the algorithm at each frame updates speed and angle to get a vortex like effect, then I repeat this every 33 millisecond (ms) and if the code is good enough it will look like this:

Everything was happy and nice until I tested the same code in Chrome:
Chrome
Seriously? Do I need a GTX Titan to run this ?
## Drunken Man Anti-Method
I don't know why but I started to look at the loop sections of the code and I was under the impression (no evidence whatsoever) that the problem has to do with the utilisation of the functional forEach:
    particles.forEach(particle => {
      //update particles

    })

    particles.forEach(particle => {
      //render the particles
    })
Which I was using in favour of the classic for from C. My mind was telling me that for each iteration a memory scope was being created and that that was messing with the speed of my animation. Of course I didn't though at that moment that this was true I should see this behaviour everywhere not only Chrome, but I was under a spell.
With that assumption I edited my code.
  for(let i=0; i<particles.length; i++) {
    let particle = particles[i]
    // update...
  }


  for(let i=0; i<particles.length; i++) {
    let particle = particles[i]
    // render...
  }

  //....
Now the code is more verbose and more C like from my point of view was screaming performant. But I run the code again and I got only 10 FPS. So the code now, was not only slow but look uglier, this is what happen when you use the “drunken man anti-method”.
Solving The Mystery
Ironically Chrome has one of the best tools to instrument Javascript applications and after this humbling experience, I decided that maybe I should give it a try, so I run the profiler and got this:

My first surprise is to see how much the profiler has improved, I'm able to see the correlation between the frames, time and instructions executed.
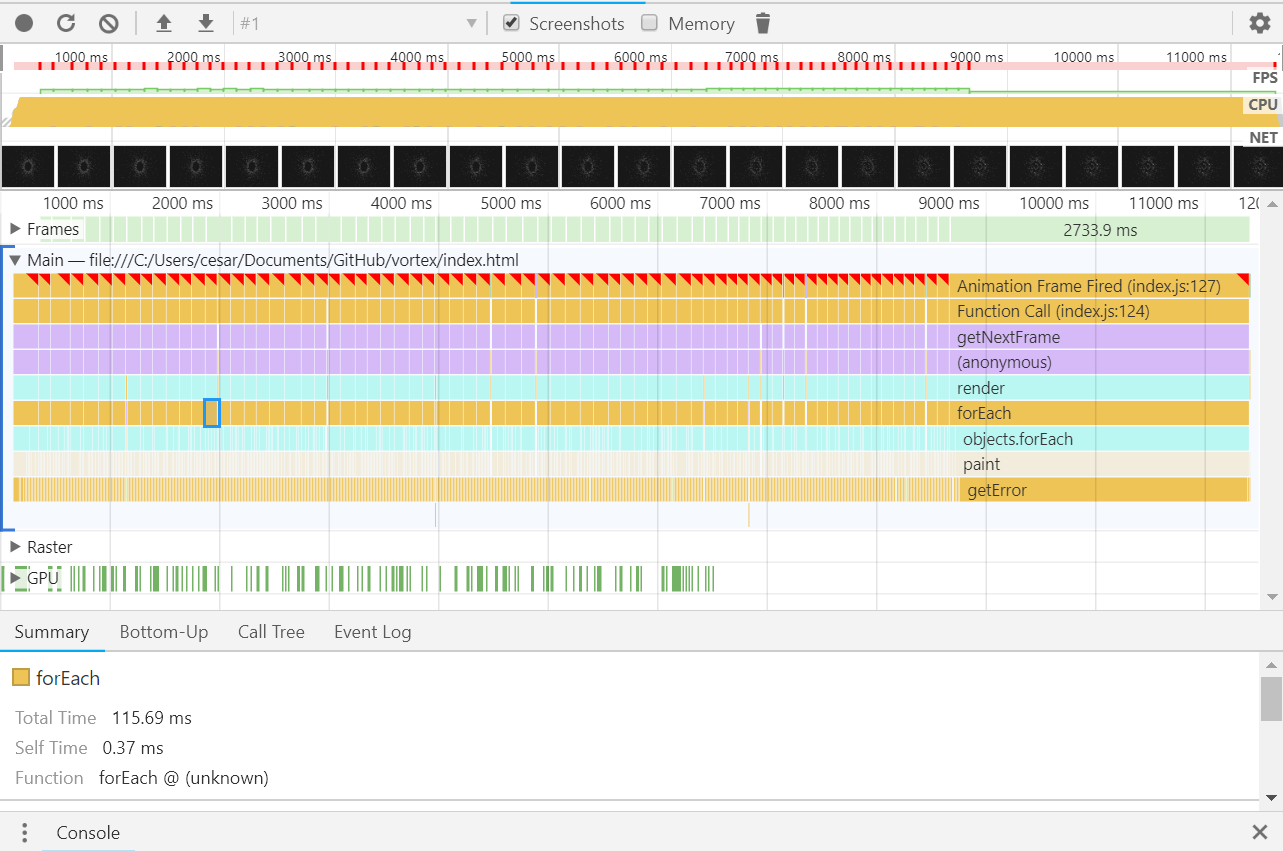
To hunt the bottleneck I just need to look for functions that are beyond the 33ms threshold, the profiler has facilitated this task by painting in yellow the spots that are lagging the most.
To look for a more detailed view I used the Call Tree section.
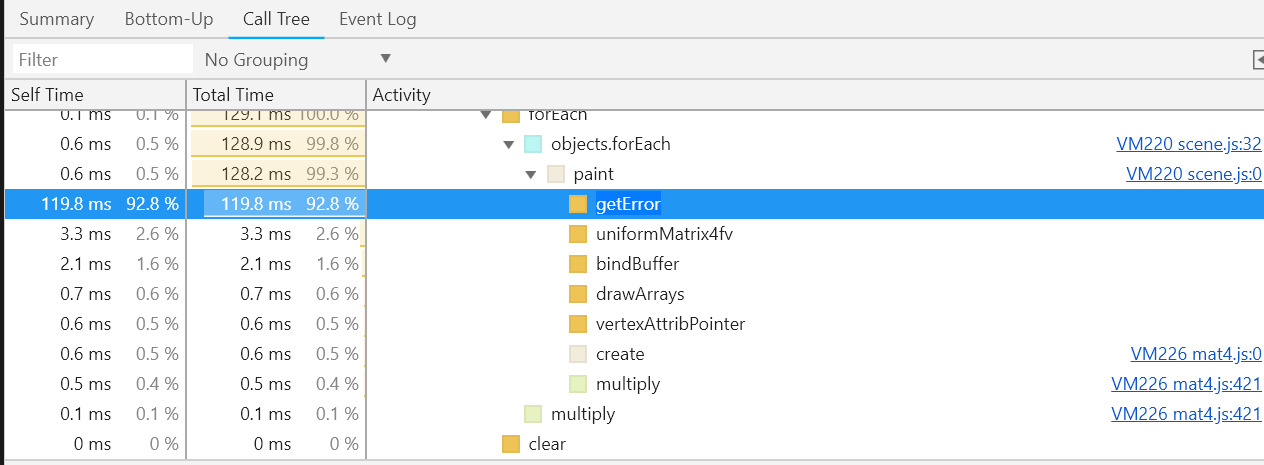
The performance problem was because I was calling gl.getError() inside the paint function, in Chrome.
paint(object) {
  /*
     loading particles into WebGL 3.3ms
  */
  gl.getError() // 119.8ms
}
That method gl.getError() logs to the console any exception that happens on WebGL and for some reason calling this function is very slow (≈119ms) on Chrome, even when I run my demo with the inspector closed while other browsers like Edge seems to deactivate that logging mechanism.
I rolled back those ugly changes and run the code again, the demo now runs at 60 FPS across all browsers (Android included).
Always measure
The main problem was a mix of preconceived and laziness and as Michael Abrash put it his book the Graphic Programming Black Book.
Assume nothing… If you don’t measure performance, you’re just guessing, and if you’re guessing, you’re not very likely to write top-notch code.
If you want to take a look at the source code, the project is published in Github.