Performance Showdown: Rust vs Javascript
After spending some weeks playing with Rust, I felt ready to test my skills and try some programming challenges in the Advent Of Code. My approach to tackle some of those challenges was to solve them using Javascript (I use it in my day to day) first and then port the code to Rust. While writing the port I just focus on getting the Rust code as elegant as possible to achieve that I research the Rust API's to get syntactically correct. It was after finishing porting this puzzle in particular and feeling a sense of accomplishment that I decided to test how the Rust compiled code will perform against Javascript interpreter.
Naive Algorithm
Before jumping to the whom-was-slower-and-why, let’s take a quick look at puzzle (so you see there is no hidden agenda) which goes like this:
You are given an input string with N amount of characters and we should write an algorithm that find and remove any sequential pairs of characters that similar but have different capitalisation, examples of this are:
bB # Remove
bb # Do Nothing
ab # Do Nothing
The algorithm should re-evaluate the string recursively searching for new pairs created after the removal, something like tetris.
We have this input:
# remove bB
tdabBADp
We should remove bB to get:
# remove aA
tdaADp
Then because aA has been formed we should eliminated this too:
# remove dD
tdDp
Then we remove dD and the final string should be:
tp
My Solution
To solve this I wrote two functions, one that process takes array of characters, traverse the array a pair at a time and validate that they follow the rules mentioned above:
Rust
fn process(tokens: &mut Vec<String>) -> i32 {
  let mut polymer: Vec<String> = Vec::new();

  while let Some(token) = tokens.pop() {
      if polymer.is_empty() {
          polymer.push(token);
          continue;
      }

      let candidate = polymer.pop().unwrap();

      if !react(&candidate, &token) {
          polymer.push(candidate.to_string());
          polymer.push(token.to_string());
      }
  }

  polymer.len() as i32
}
Javascript
function process(data) {
  let queue = []  // Save here tested characters.

  while(data.length > 0) {
    let candidate_1 = data.pop()
    let candidate_2 = queue.pop() // get the last character that passed the test.

    if (candidate_2 === undefined) {
      queue.push(candidate_1)
      continue
    }

    let react = reacting(candidate_1, candidate_2)

    if(!react) {
      queue.push(candidate_2)
      queue.push(candidate_1)
    }
  }

  return result.length
}
Notice the performance optimization by keeping the last character in a different queue, that way we don’t need to traverse the whole array looking for matches after a previous removal.
Then each pair of characters is evaluated using a function called react that returns true or false if the pair need to be removed:
Rust
  fn react(token1: &String, token2: &String) -> bool {
    if token1.to_lowercase() == token2.to_lowercase() {
        return token1 != token2
    }

    false
  }
Javascript
function react(candidate_1, candidate_2) {
  if (candidate_1.toLowerCase() === candidate_2.toLowerCase()) {
    if ( candidate_1 !== candidate_2 ) {
      return true
    }
  }

  return false
}
Basically is a rudimentary implementation of an equals-ignore-case plus an additional check to see if they are they same character (the same capitalization).
To complete the challenge each version (Rust, Javascript) needs to reduce a large string (50K character) which is good enough to test how well one version performs against the other, then I run each code using Linux time and got this:
# Javascript (Node.js)
  real  0m0.374s
  user  0m0.301s
  sys   0m0.030s

# Rust
  real  0m0.720s
  user  0m0.636s
  sys   0m0.012s
This is a surprising turn of events, here we can see the Rust version is 2x slower than Javascript, How? My first reaction (in an act of self denial) was to check the compiler flags opt-level and after checking that was fine, which to be honest won’t make a difference, I started to look for inefficiencies in the code, first using the ancient Drunk man anti-method technique and when that didn’t work, I end up settling for a more scientific method of profiling my code with perf.
Debugging
Every time you are debugging a performance issues you might feel tempted to start adding your own function to calculate the duration of suspicious section of code (like I used to do, in the past). Perf does this for you by taking various approaches such as listening to CPU/Kernel performance events metrics emitted by the system in reaction of your process while running. Things like this makes perf the tool of choice to debug performance issues, so let’s see how it works.
Debugging Symbols
Before we start we need to enable the debugging symbols on the Rust compiler, this will make perf reports more informative. To enable this add debug=true to the Cargo.toml:
[profile.release]
opt-level = 3
debug=true
Attaching Perf
I recompiled the code and attached perf:
cargo build
./target/release/day-5 & perf record -F 99 -p `pgrep day-5`
- First we run the Rust program (
day-5) and we send it to the background using the ampersand (&) symbol. - Next to it, so it executes immediately, we run
perfthat receives the process identifier (PID) courtesy ofpgrep day-5. - The pgrep command returns the PID of a process by name.
Here is the output:
[1] 27466
sample size 50003
--
solution 1: 9526
solution 2: 6694


[ perf record: Woken up 1 times to write data ]
[1]  + 27466 done       ./target/release/day-5
[ perf record: Captured and wrote 0.002 MB perf.data (13 samples) ]
Report
After running this multiple times,perf automatically aggregates the data to a report file (perf.data) in the same folder where we are making the call.
Now we can visualise the report with:
perf report
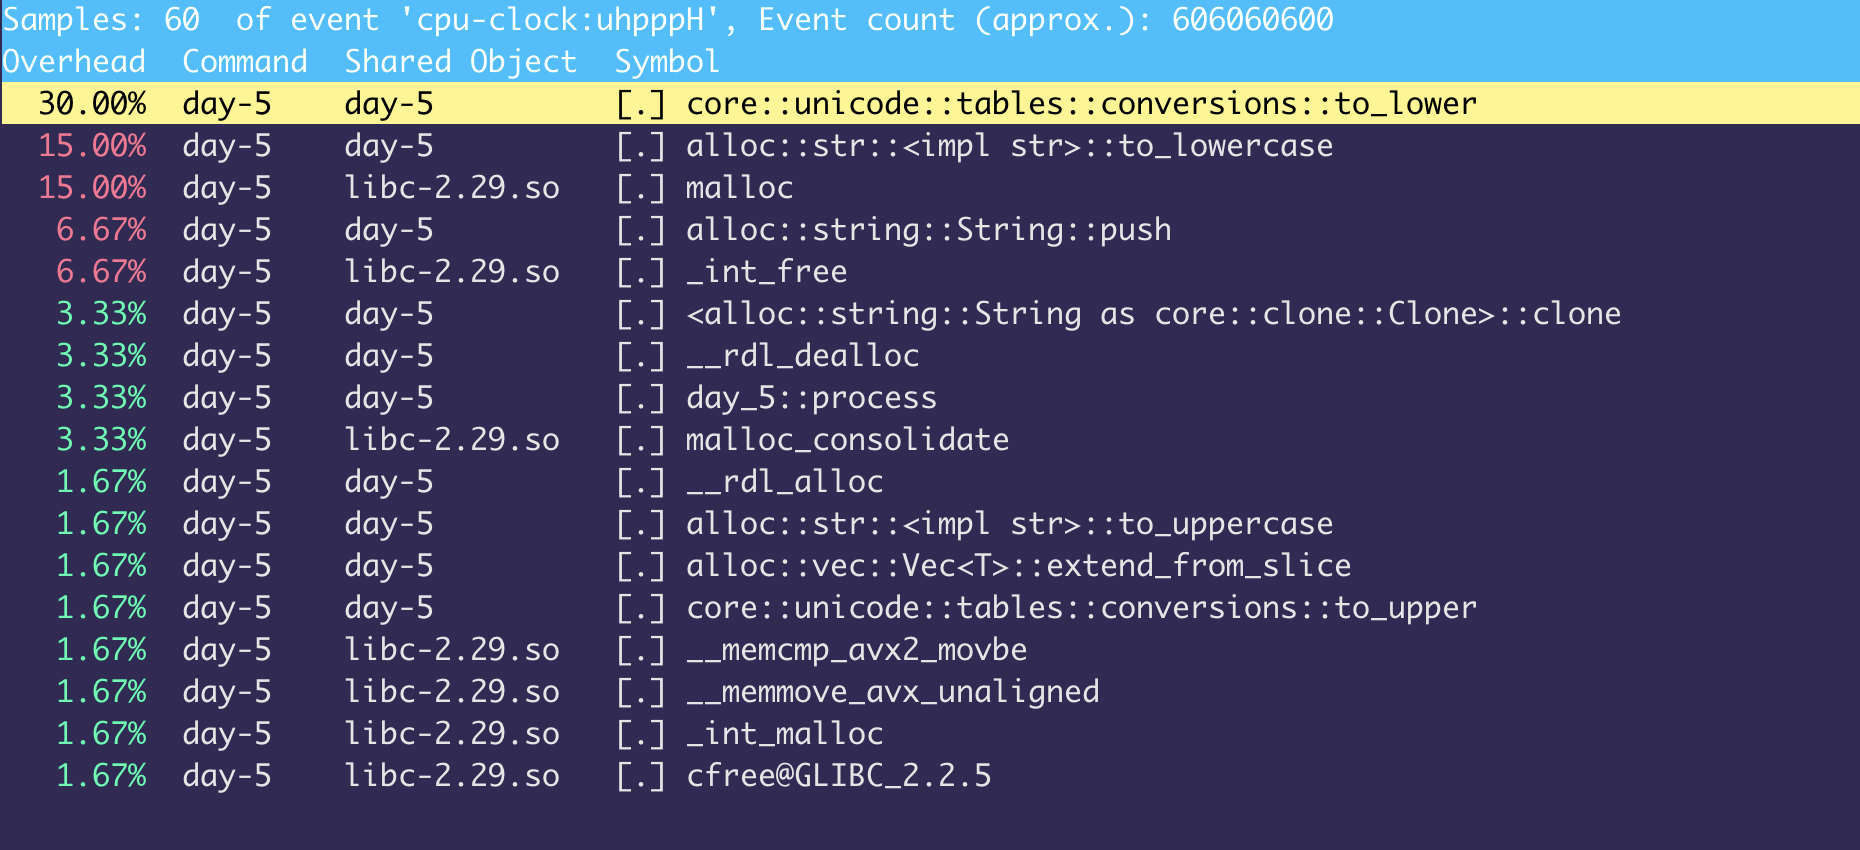
Interestingly the algorithm spend 30 percent of the time in the String::to_lowercase which is suspicious:
fn react(token1: &String, token2: &String) -> bool {
    if token1.to_lowercase() == token2.to_lowercase() {  // 30% CPU wasted here
        return token1 != token2
    }

    false
}
My first impression is that I made a mistake while running perf (never used it before with Rust), but everything started to make sense once I looked at the source code of the to_lowercase function.
What happen is that Rust lowercase function try to be correct in any language, so it delegates this conversion to a function called std_unicode::conversions this function then does a binary search of each character against a big array (≈1200) of unicode characters:
const to_lowercase_table: &[(char, [char; 3])] = &[
        ('\u{41}', ['\u{61}', '\0', '\0']),
        ('\u{42}', ['\u{62}', '\0', '\0']),
        ('\u{43}',//...≈1200 ]


 pub fn to_lower(c: char) -> [char; 3] {
        match bsearch_case_table(c, to_lowercase_table) {
            None        => [c, '\0', '\0'],
            Some(index) => to_lowercase_table[index].1,
        }
    }
Going back at the code, this binary search is done twice per iteration now multiply this by
50Kand we found the reason for the slow down.
After some googling I found that I should use eq_ignore_ascii_case instead, which basically makes this operation in linear time and for one character is nearly the same as saying constant time. I recompiled the code and run the benchmarks:
Node.JS
real  0m0.374s
user  0m0.301s
sys   0m0.030s

Rust
real  0m0.283s
user  0m0.248s
sys   0m0.005s
Now we are talking, profiling has pay its dividends and made the Rust program 2.5x faster than the original and 91ms faster than the Javascript version, I can start celebrating and telling my friends that I’m a Rust expert now. But this leaves me with some questions:
The
91msis not bad, but I wonder how much effort it will take to optimize this code to make it>1.5xfaster than the Javascript counterpart?
Performance On MacOS
While I was thinking of this and was in the middle of unpacking my Rust stickers and preparing my laptop for some re-branding, I decided to move the code (Javascript and Rust) from my Linux VM to my main OS (MacOS Catalina), once there I gave the benchmark another try because I love suffering:
Node   0.17s user 0.03s system 101% cpu 0.209 total
Rust   0.23s user 0.01s system 98% cpu 0.238 total
After seeing this my confidence in my time measuring tool (time) started to fade a bit, but once I calm down and use the XCode Instrumentation which point me in the right direction:

The slowest part of the program (Rust version) is the part that does the allocation and deallocation of memory produced when calling MacOS
malloc.
To catch this one I'll need to dig more into Rust inner workings. Does this make it more expensive to get performance out of Rust? Did I choose the wrong abstractions? That's for another post. If you want to take a look at the code yourself here is the Rust and JS, if you have any improvement, idea, suggestions or performance trick let me know by Twitter, pull request or open an issue.